
BIO315 Laboratory Guide #3
THE JAMMING AVOIDANCE RESPONSE
IN KNIFEFISH
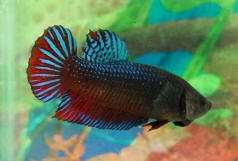
The green knifefish Eigenmannia virescens and black ghost knifefish Apteronotus albifrons are freshwater fish of turbid streams and rivers. In each fish the primary sensory modality is electroreception. Each fish generates an electric field via a specialized organ in its tail. Knifefish are weakly-electric "wave-type" fish, meaning that the electric organ discharge (EOD) is a continuous, nearly sinusoidal oscillation at about 200-600 Hz, oriented along the central axis of the body. Specialized electroreceptive organs located mainly around the head detect this field and perturbations in the field produced by objects in the water. This sensory information is relayed to the lateral line organ of the midbrain (inferior colliculus/torus semicircularis), which also processes vibrational information from the lateral line receptors. Electroreception is used for orientation, predator detection, and prey localization.
On its own, each fish tends to operate at a remarkably steady and constant frequency, if conditions around it remain constant. However, when more than one knifefish is operating in the same local area there is a potential problem, namely that the EOD from one fish could interfere with electroreception of the other. This could produce a phenomenon called "jamming", familiar to radio and radar operators. Knifefish solve this problem by executing a jamming avoidance response (JAR), orchestrated by the central nervous system. If a fish is exposed to a potential jamming signal near its own operating frequency, it rapidly shifts its EOD frequency away from the jamming frequency. This lab will explore several behavioral response parameters of the JAR.
This lab uses some rather complicated equipment which would require a multi-hour tutorial to become thoroughly familiar with. Consequently, the instructions below are rather "cook-bookish" in nature. It is important, however, that you understand the sensory/behavioral theory and functional consequences of what you are doing in this lab, so feel free to ask lots of questions.
I. SETUP
A. Aquarium and Fish
The starting position for this lab is with:
1) A fish loaded into a recording chamber within a 2.5 gal aquarium tank
2) power water filter unplugged, emptied, and removed
3) a pair of recording electrodes at opposite ends of the recording chamber, connected to channel 1 of a Model 1700 amplifier
4) a pair of stimulating electrodes positioned at opposite corners of the tank
B. Model 1700 AC Amplifier
This amplifies the signal coming from the fish and filters out noise. This is a four-channel amplifier, but we will be using only channel 1. Confirm the following settings on this amplifier in this order:
1) Amplifier #1
low cutoff knob 10Hz
high cutoff knob 5 kHz
gain knob x 100
mode switch REC
notch switch IN
2) Channel 1 Output connected via a T-connector to:
PowerLab CH1+ input
Stereo Amplifier tuner right channel
3) Power ON (switch lit up)
C. Function Generator
This produces a sinusoidal jamming signal when the "TO AQUARIUM" cable is attached to stimulating electrodes in the water. Confirm the following settings on generator in this order:
1) The �TO AQUARIUM� cable from the Function Generator output T-connectors to the stimulating leads in the tank is UNPLUGGED � VERY IMORTANT!!
2) Power ON (digital display activates)
3) Top row of buttons:
Frequency range 100
Second row of buttons:
wave form ~ (sinusoidal)
Att -20dB button in (light on)
Third row of buttons/knobs:
Duty, CMOS, Offset pushed in
Amplification pulled out (-20dB), turned half way up
Set frequency knob to produce ~300Hz signal as indicated in the digital display
Output is connected, via 2 T-connectors to:
PowerLab CH3+ input
Stereo Amplifier tuner left channel
The stimulating electrodes are in � BUT THIS CABLE IN NOT PLUGGED IN
II. THE ELECTRIC ORGAN DISCHARGE (EOD)
A. Stereo Amplifier
This sends the amplified fish EOD and the jamming signal to two speakers so that you can monitor them. Confirm the following settings in this order:
Volume knob � way up
Mono button out (stereo)
Tone knob midway
Balance knob midway
Source knob Tuner
Power ON (red light on)
You should hear a variable low amplitude tone in the right speaker. This is your fish EOD. Cool, eh? Note that the fish is NOT producing a sound. The fish is producing a sinusoidally oscillating electrical field with which the Stereo Amplifer is driving the speakers, to produce a sound.
You should hear a continuous low amplitude tone in the left speaker. This is directly monitoring the Function Generator output.
1) The two speakers should be producing different tones at about the same amplitude (loudness). If not, adjust the AMPL knob on the Frequency Generator until the sounds from the two speakers are at about the same amplitude.
2) Now adjust the Frequency knob on the Function Generator until the two tones are identical. You may want to continue to adjust the AMPL knob to help your discrimination. Note that as you approach the EOD frequency, you will heat a low frequency �beat� which is simply the arithmetic difference between the Function Generator frequency and that of the EOD. When you get a perfect match, with no beat, record this frequency as the base frequency of the fish EOD here:
Hz.
B. PowerLab/PC Computer
The instructor will have turned on the PowerLab box and have a SCOPE Settings file called �JARMeister� running:
1) Hit the Start Button at the lower right. Confirm that the SCOPE program is running and continuously sampling. Locate the Page Comment icon at the lower left. Confirm that two channels are being displayed:
top channel is "Knifefish EOD" - label on Y axis
bottom channel is "Jamming Signal" - label on Y axis
TIME BASE 40kHz Samples:2560 Time: 50 msec
2) You should see two traces on the screen, each of which is refreshed once per second. The upper trace is your fish. This will be a distorted sinusoidal waveform, with about 12-30 waves per sweep. The lower trace is the direct output of the function generator. This should be a pure sine wave at a nearly identical frequency to that of the fish.
C. Preliminary Recordings
1) Stop the display via the STOP button at the lower right.
2) Pull down the FILE menu, select NEW, then select NO to clear the screen and the active memory.
3) Pull down the SETTINGS menu to SAMPLING . . .
set MODE to MULTIPLE; SAMPLES to 10; DELAY to 1 second
click OK to close
4) Hit the START button. This should produce 10 sweeps at 1 second intervals.
5) Go to any one of your traces (use cursor keys or click on page # at bottom of the SCOPE window. To measure the fish frequency do the following steps:
a) Click, drag, and release the M marker from the lower left corner to the fist peak of the fish trace.
b) Move the active cursor exactly 10 peaks farther along and center in on the peak
c) Read the deltat value in the Cursor box at the top center. This is 10x the EOD wavelength in msec.
d) Call up the PC calculator, then divide 10000 by this deltat value. This is the EOD frequency of the fish. You should get a value that very closely matches your earlier estimate. Enter this as your new base EOD frequency:
Hz
III. THE JAMMING AVOIDANCE RESPONSE (JAR)
A. Testing the JAR
1) Your instructor will help you to adjust the amplitude of the jamming signal to an appropriate level.
2) Disconnect the entire T-Connector assembly from the Function Generator. Now connect the TO AQUARIUM cable to the free end of the T-connecter assembly. From now on you will connect and disconnect the Function Generator�s jamming signal from the aquarium, the PowerLab Ch3 input, and the Stereo Amplifier simultaneously by using this T-connector.
3) Pull down the FILE menu and choose NEW. Do not save your practice data. Set the Function Generator to produce a jamming signal ~5Hz higher than the base EOD frequency. Record this frequency here:
Initial Jamming Frequency Hz
4) Use the SETUP menu to set up for 30 sweeps at 1 second intervals. Go to the Comment box and enter a label, such as "JAR test, jam at +5Hz"
5) Click on the display window to reactivate it
6) You will have to watch the display closely and plug/unplug jamming signal T-connector at the Function Generator precisely at the specified moments. Click on the START button to start sampling:
Sweeps 1-10 Output T-assembly is unplugged (prejamming)
Plug in jamming T-connector
Sweeps 11-20 Output T-assembly is plugged in (jamming)
Unplug jamming T-connector
Sweeps 21-30 Output T-assembly is unplugged (post jamming)
7) Find the two sweep pages which correspond to immediately before the onset of jamming (#10?) and immediately after the offset of jamming (#21?). Measure and compute EOD frequencies (Channel A) for these two traces. Now measure and compute the jamming signal frequency from its channel (Channel B) for one of the sweeps (#11-#20?) during which the jamming signal was connected.
8) Did the fish change its EOD in response to the jamming? Did the EOD frequency go up (toward the jamming frequency) or down (away from the jamming frequency)? In other words, did the fish execute an effective JAR?
9) Save this data file to disk.
B. Quantifying the JAR
1) Choose NEW under File to clear the display
2) Repeat the recording sequence used above with the following Function Generator settings (jamming frequencies):
EOD + 20 Hz
EOD + 15 Hz
EOD + 10 Hz
EOD + 5 Hz
EOD + 2 Hz
EOD - 2 Hz
EOD - 5 Hz
EOD - 10 Hz
EOD - 15 Hz
EOD - 20 Hz
3) Wait at least two minute between trials. These can all be saved to a single data file if you wish, e.g.:
sweeps 1-30 EOD+20HZ
sweeps 31-60 EOD+15Hz
sweeps 61-90 EOD+10Hz
etc.
4) You can use the Comments box to attach a text comment to the start of each trial during your two minute between trial waiting period. Don't measure anything now, just gather your data and analyze it later.
5) Save your data file(s) to disk.
6) At a later time, produce a plot of the JAR magnitude (postjamming EOD- prejamming EOD) as a function of jamming frequency proximity (jamming frequency - prejamming EOD). Graphing 101: JAR magnitude goes on the Y axis and jamming frequency proximity goes on the X axis (why?). Excel is an excellent way to do this. Make sure that you determine ALL frequencies by measuring both the fish EOD and the jamming wavelengths from the SCOPE data, rather than just assuming that the Function Generator is accurate or that the base EOD frequency is constant.
7) The easiest way to do this is to set up an Excel file with the following columns:
A) target jamming proximity in Hz (20,15,10,5,2,-2,-5,-10,-15,-20)
B) prejamming EOD wavelength in msec (measured from trace ~#10, channel A)
C) postjamming EOD wavelength in msec (measured from trace ~#21, channel A)
D) jamming wavelength in msec (measured from trace #15, channel B)
E) prejamming EOD frequency in Hz (= 1000/B)
F) postjamming EOD frequency in Hz (= 1000/C)
G) jamming frequency in Hz (= 1000/D)
H) jamming proximity in Hz (= G-E)
I) JAR magnitude in Hz (= F-E)
8) Now plot columns H and I against each other, using the Graphing wizard and choosing Scatterplot..
C. Time Course of Recovery From JAR
If you have time, complete the following:
1) Clear the display by choosing New under the File menu.
2) Set the Jamming signal to base ~EOD + 5Hz
3) Set up the recording for 50 sweeps at 1 second intervals
4) Perform the following:
sweeps 1-10 TO AQUARIUM T-connector unplugged (prejamming)
sweeps 11-20 TO AQUARIUM T-connector plugged in (jamming)
sweeps 21-50 TO AQUARIUM T-connector unplugged (postjamming)
5) Save your data file to disk.
6) At some later date produce a plot of deltaEOD frequency (prejamming EOD- postjamming EOD) as a function of postjamming time (1-30 seconds).
D. Finishing up
1) Disconnect the TO AQUARIUM T-connector.
2) Turn off the Function Generator. Turn off all amplifiers. Quit JARMeister.
3) Release the fish from the recording chamber.
4) Restore the power water filter.
IV . WRITE-UP FOR THIS LAB
The write-up for this lab should include a brief introduction, well labeled graphs for parts IIIB and IIIC above, and a discussion of what your results mean.